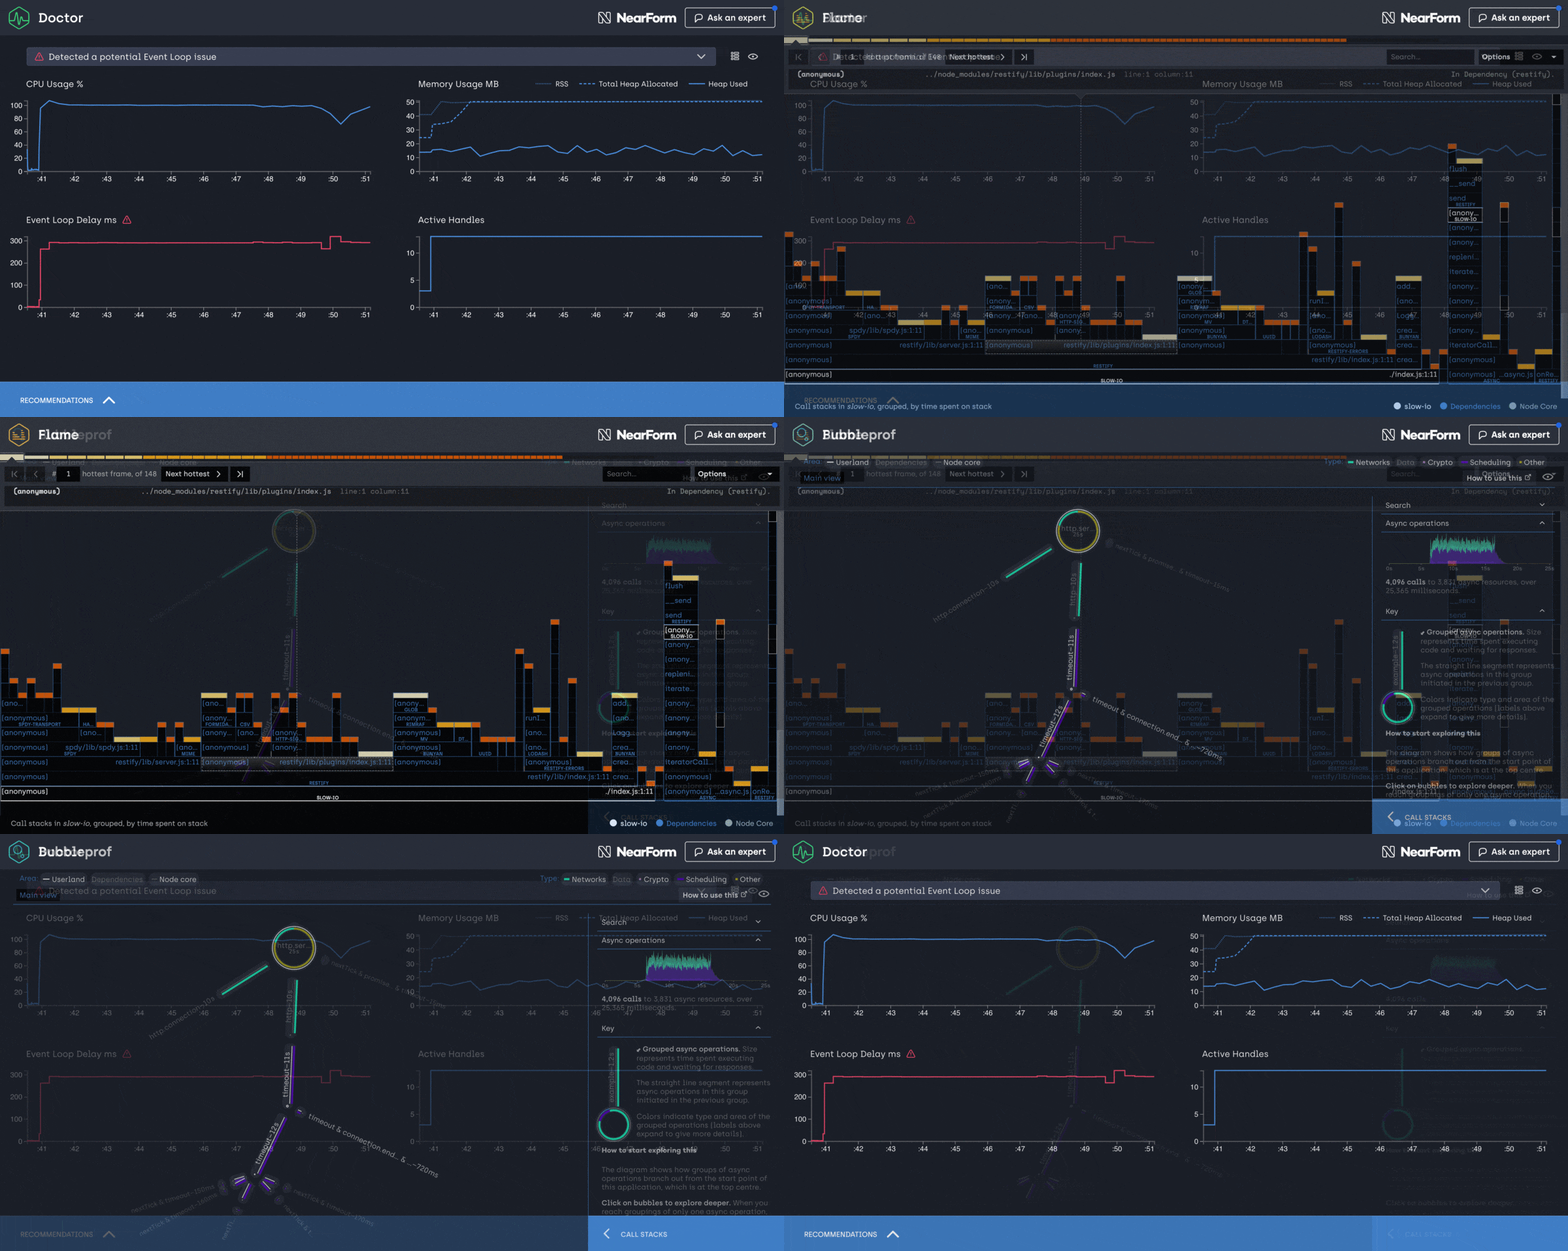
Clinic.js
Note
Clinic.js is not being actively maintained. Due to its strong ties to Node.js internals, it may not work or the results you get may not be accurate.
An Open Source Node.js performance profiling suite originally developed by NearForm.
Demo and detailed documentation: https://clinicjs.org/
Install
npm install -g clinic
Getting started
As a first step, run the clinic doctor:
clinic doctor -- node server.js
Then benchmark your server with wrk or autocannon:
wrk http://localhost:3000
autocannon http://localhost:3000
If you want to run autocannon as soon as your server starts listening you can
use the --autocannon option using subarg syntax.
clinic doctor --autocannon [ / --method POST ] -- node server.jsOther benchmarking tools like wrk can be started in a similar way using the --on-port flag
# $PORT is the port the server is listening on
clinic doctor --on-port 'wrk http://localhost:$PORT' -- node server.js
Finally shut down your server (Ctrl+C). Once the server process has shutdown
clinic doctor will analyse the collected data and detect what type of issue
you are having. Based on the issue type, it will provide a recommendation for
you.
For example, to debug I/O issues, use clinic bubbleprof:
clinic bubbleprof -- node server.js
Then benchmark your server again, just like you did with clinic doctor.
Note that when looking at the CPU graph you might notice that it doesn't necessarily go from 0-100 but might go from 0-200 or higher. This is because the percentage reflects the total amount of CPU cores your computer has. Node.js itself uses more than one thread behind the scene even though JavaScript is single threaded. V8 (The JavaScript engine) runs the garbage collector and some optimizations on background threads. With worker threads, the CPU will also utilize more than 100%. The visible percentage is always the combination of all these factors together.
NOTE: Exiting the process forcefully can result in wrong or no generation of log files.
Windows + PowerShell
In order to diagnose your application with node clinic, you should execute your application after double hyphens(--),
e.g: clinic doctor -- node myapplication.js.
On Windows using PowerShell as terminal the above statement might not work because PowerShell parses everything after --
as literal arguments instead of options.
To avoid that behavior you can either quote ("--", '--') or escape (--) the double hyphens.
Supported Node.js versions
Clinic.js relies heavily on Node.js core instrumentation available in later versions.
Currently the supported Node.js versions are >= 16.
Examples and Demos
- A set of simple Doctor examples
- A set of simple Bubbleprof examples
- A MongoDB-based Bubbleprof demo/example
- A Flame demo/example
Report an issue
If you encounter any issue, feel free to send us an issue report at:
https://github.com/clinicjs/node-clinic/issues
More information
For more information use the --help option:
clinic doctor --help
clinic bubbleprof --help
clinic flame --help
clinic heapprofiler --help
- The
doctorfunctionality is provided by Clinic.js Doctor. - The
bubbleproffunctionality is provided by Clinic.js Bubbleprof. - The
flamefunctionality is provided by Clinic.js Flame. - The
heapprofilerfunctionality is provided by Clinic.js Heap Profiler.
Flags
-h | --help                Display Help
-v | --version             Display Version
--collect-only             Do not process data on termination
--visualize-only datapath  Build or rebuild visualization from data
--on-port                  Run a script when the server starts listening on a port.
--autocannon               Run the autocannon benchmarking tool when the server starts listening on a port.
--dest                     Destination for the collect data (default .).
--stop-delay               Add a delay to close the process when a job is done through either `autocannon` or `on-port` flag (milliseconds)
--name                     The --name flag sets a name for the output data, allowing you to replace existing reports without generating new ones. Example: <code>.clinic/node-19-test.clinic-flame</code>
Programmable Interfaces
Each of the tools has a programmable interface which you can read about in their repos.
Profiling In Podman Container
Applicable for doctor, bubbleprof, flame or heapprofiler
In case you profile your application inside of container environment using podman (docker alternative).
And you start profling by providing CMD step in the dockerfile.
CMD clinic flame -- node index.js
Then when you run container it exits immediately with 0 code.
It is caused by a question to collect anonymous usage statistics.
A workaround is to use environment variable NO_INSIGHT with any value.
In this case the question to collect anonymous usage statistics is suppressed. Thus profinling and application server start as expected.
CMD NO_INSIGHT=true clinic flame -- node index.js


